Tag Archive: swimlane diagrams

Process Mapping? I’d rather be Napping.

So I’ve heard a lot of people say they are so fascinated by what I do in the process improvement world, and how great they think it is , but how “it’s not for them”.  Using my coaching skills, I usually say something like, “Oh yeah?  Tell me about why it isn’t for you”.

Here are some of the responses I get:images

“Snore.  Processes are super boring. My company is really intuitive, and we just know exactly what to do and we fix it.” – my super annoying friend

“Processes, who needs it? I already know my team is garbage and as soon as I can replace them, things will turn around”. – a client who later realized her team was great because process mapping revealed a culture issue

“Ugh.  Sounds bureaucratic. I’m an entrepreneur.  There is nothing corporate about he way I run my business, and to be honest we don’t need it.” – my sister-in-law

PROCESS MAPPING3 Signs You Need Process Mapping STAT!

  1. Something is wrong and you “think” know exactly how to fix it.  How do you know what’s wrong?  What leads you to believe that?  What is the expected outcome if you make the change? You might be right. Intuition is super important.  Why not validate those gut feelings with some evidence in a process map? It’s a great way to get buy in from your stakeholders and employees!
  2. You “think” your employees are the problem. They suck.  While this is the first place many people look for solutions, it’s usually something else.  Why do you think they suck?  What tells you that? What could be inhibiting them? Have you asked them? Research shows that if you take great people and put them in a bad process, the process will win every time. Process mapping sometimes uncovers secrets that are hiding within a bad process.
  3. You “think” process is too rigorous.  Well, it can be, but it doesn’t have to be.  The right people, the right style, and the right moment can take you from being a fly-by-the-seat-of-your-pants entrepreneur to a being a strategic one.  Why not set the stage so you can pass the tasks that aren’t worth your time (or you aren’t great at) to someone who can actually add value (so you can go and be amazing). Process mapping identifies those tasks and lets you properly divide them up.

If you’re not a “process person,” or even if you are but don’t have a lot of time, we can help you. We are expert at coming in, talking with you and your team, and uncovering the hidden opportunities to improve your business.

Even better – why not build process improvement and process mapping capacity on your team? We offer public workshops that are fun, interactive, and relevant. Check them out by clicking here, and contact us if you want to know more.

#whiteboardworskhops #theyredifferent

Until Next Time,

Nicole

Screen Shot 2016-06-16 at 4.09.44 PM

How To Solve The Biggest Problems With Process Mapping

Post-Process Mapping

A few weeks back Ruth blogged about how to do a basic process map (click here to check it out) and it included a free process template for you to use as well. You’re welcome.  Process mapping is a huge part of our business. We know process mapping creates engagement and buy-in for process change  (when done in a workshop setting) , is a great visual tool, and can improve effectiveness and efficiency.

whiteboardconsulting.ca/staging: Peacocks and ProcessesRuth talked about the key steps in documenting a process; the steps include:

  1. Determine the swimlanes
  2. Determine the trigger point
  3. Consider the end point
  4. Put a circle shape in the swimlane for the person/group that starts things off. Write the word “START” in it.
  5. Put a square shape next to the circle and label it #1, and write the step.
  6. Proceed with each consecutive step.
  7. Add the arrows last (you almost always have to change them as you go).
  8. When you reach the end point, put a circle with the word “END” in it.

AND, I can’t believe Ruth forgot this.  I am going to gloat since she is a stickler for this one.

9. NUMBER your steps (post-production comment from Ruth – I am mortified! I can NOT BELIEVE I forgot that… and is such a public way! I will never live it down. Sigh.)

We received a lot of really good feedback on this blog, and people loved the template.  The big question was:

What do I do next, after the Process Map?what-next

Great question.  The next 2 steps are to validate your process map and look at value added steps.

Validation

So if you’ve done your process map in a workshop style setting, you likely had many of the stakeholders (the swimlanes) of the process in the room.  So validation in this case is finalizing that process map and sending it back out to those participants to see if what you’ve documented is accurate.

If you’ve worked on a process map by yourself,  validation becomes even more important. You are verifying that all the steps are accurate and represented properly. In fact, this is an opportune time to re-group and re-engage to validate the map, or engage for the first time.  A few things to keep in mind:

  • Talk to the people in the process and follow the product or service through the service to make sure steps and swimlanes have been captured accurately.
  • Make sure to capture easily seen or invisible steps (i.e. where the product or service is waiting, or being moved to another area)
  • Ensure that you haven’t mapped the best case scenario, or worst case scenario.  The map should be representative of how the process normally works.

Now for the meaty stuff….

Next we are going to analyze the process! First let’s determine whether a step adds value or not? Ask these 3 questions:

  1. Does the customer consider this step important?
  2. Has the product or service had a physical change?
  3. Was it done right the first time?

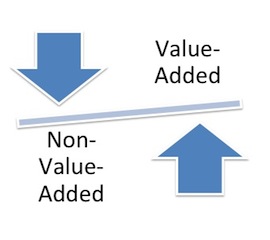
Here you can identify the type of non-value added activities. Non-value added activities include:value-added-non-value-added

  • Moves: Steps in the process where the product or service is in transit from one place to another. How many times and to how many people in your organization does this touch?
  • Delays: Steps in the process where the product of service is waiting for the next step in the process (a great example of this is approvals or sign-offs). This is your classic bottleneck.  
  • Set-up: Steps in the process that prepare the product or services for a future step
  • Internal Failures: Steps that have to be re-done (i.e. iterations of something before it reaches final approval) that are detected internally
  • External Failures: Steps that have to be re-done that are detected by the customer (i.e. damaged product at shipping….)
  • Control/inspection: Steps where the product or services is reviewed to ensure customer satisfaction (i.e. Quality Control)
  • Value Enabling: Steps that don’t add value but are necessary for the functioning of the organization

How do you do this? Well by filling out the super easy Process Summary Analysis Template of course!

Process Summary Analysis Template Instructions

Step 1: Put in the number of process Steps

Step 2: Enter the amount of time it takes to complete this step in minutes (don’t know exactly? Time it a few times or guesstimate for now), sum that row in minutes, and its % is 100% because we are summing the whole process.

Step 3: Identify which process steps are value added and not value added. Sum the number of minutes for all the boxes that you’ve identified (in this case we have an x in step 1 and step 6 at 1 minute and 5 minutes respectively, so we have 6 minutes of value added work and 75 minutes of non-value added work).

Step 4: For those steps that are not-value added, identify what the type of non-value added activity it is.

Step 5: Assess the percentages, and start working on the biggest first.  In this case 56% of the non-value added steps are due to External Failures.

Screen Shot 2014-09-19 at 9.48.28 AM

That should keep you all busy for a little while!

Ruthie…I guess this means you have to give our readers some Cause-Effect Diagram templates next week. You’re welcome. 🙂

Also stay tuned for more info about our new “Leading Process Change” Course!  Over the next few weeks you’ll see guest blogs from our speakers, more info on the course, and more templates I think!

What do you think of this template? Did you use it? Was it helpful?  Let us know at info@whiteboardconsulting.ca/staging or Tweet us at @whiteboardcons! More questions for us?  Use #DearRuthandNicole!

Until Next Time,

Nicole


How to Process Map When You Don’t Know What You’re Doing

whiteboardconsulting.ca/staging: Peacocks and ProcessesThis week a friend emailed me to ask for some process improvement advice. He has been thinking about a business process in his office, and knows something isn’t working the way it should, but isn’t quite sure what it is.

In fact, he wasn’t even sure how to articulate what he was looking for.

“This is probably the kind of thing that you guys could do for me, but I don’t even know what I want yet. Do you have anything like a template or a document that lists your process for drawing out how a process is working?”

Funnily enough, we don’t. When Nicole and I facilitate process improvement sessions it comes to us naturally, based on a few key questions:

  1. What is the “pain point” that you want to fix? Or, what is that “one thing” that drives you bananas when you drive home on Friday evenings, thinking “if only we didn’t have to deal with “this thing”, everything would be better?
  2. What kicks off your process? What’s the first step? You might think this is an easy question, but we once spent 45 minutes with a client helping them answer it.
  3. When is your process finished? What’s the last step? Is it when something is produced? Or when the customer recieves it? Or when the cheque comes in?

And that’s enough to get us started. From there we interview the key people involved in a process, draw it on huge Post-It paper on the wall, and then review it with people to ensure it’s accurate.

At that point the opportunities to improve pretty much jump off the page.

My Response to Him

Assuming you know nothing about a process map (forgive me if you do):

  • square shapes represent a step in the process
  • circles/ovals are beginning and end points
  • diamonds are decision points
  • arrows direct the flow from one step to another
  • the rows, or swimlanes, represent each person or group or organization who “touch” the process
  • A completed process map a beginning and end (duh), has all the process steps in the appropriate row depending on who completes the step, has decision points where ever an approval is needed (e.g. Approved? Y/N) and then appropriate steps for both Yes and No possibilities, has numbered steps (makes it easier to refer to specific steps later if you’re talking to someone about it).

You can use a pencil to document your process directly on the page, or you can have a big piece of paper on the wall and use sticky-notes (one for each step). This makes it easy to move them around if you need to. Use the attached template to help you out. (Click here for the process map template: WBC Process Map Template.)

  1. Determine the swimlanes – who has some involvement (no matter if it’s only one step) in any aspect of the process?
  2. Determine the trigger point – what kicks the process off?
  3. Consider the end point – how will you know when the process is done?
  4. Put a circle shape in the swimlane for the person/group that starts things off. Write the word “START” in it.
  5. Put a square shape next to the circle and label it #1, and write the step.
  6. Proceed with each consecutive step.
  7. Add the arrows last (you almost always have to change them as you go).
  8. When you reach the end point, put a circle with the word “END” in it.

His Response to Me

Ever the clown, my friend responded with, “do you realize how ironic it is that you don’t have a process document for your process mapping process?”

Isn’t it though. So ironic. See if I help HIM out again… sheesh…

Until next time,

Ruth.

Process Improvement via The Whiteboard Way© – Step Two

Last week Ruth started a series on The Whiteboard Way©, our very own process improvement methodology (this proved to be advantageous for me, as I was at a creative standstill with blog ideas. Thanks Ruth!)

First, a Little Background

A little recap – last week Ruth talked about the most critical step in The Whiteboard Way© – Define it! By removing assumptions and pre-conceived ideas about the solution, it allows you to be unbiased and creative in the possible solution.Today I’m going to delve into my love-hate relationship with process mapping.

Why do we process map?

Approximately 65 percent of the population are visual learners and people process visual information much faster.  Visually representing a process allows you to see things that may not necessarily jump out at you when you read a procedures document or when you just “imagine” the process in your head. Here are some things that jump out at you when  you process map:

  1. Touch points. How many people, teams, departments must a product or service pass through to reach the customer? The higher the number of touch points in the process the longer the process will take, and the higher likelihood that a defect (or error) will occur.
  2. Duplication. Process maps are great at visually highlighting work that is duplicated across the company by different teams. With our clients, we usually see a map highlight, for example, people that enter the same data into different databases, or forms in different areas of the organization.
  3. Bottlenecks. Bottlenecks occur when there is a blockage in the flow of information or work. For example, when a busy executive is holding an approval at their desk for days upon end.

So Ruth helped you develop your problem here. Some examples of  “Good” Problem Definitions are below:

  •  In the last 3 months we have had to fix this issue 6 times for four customers, causing dissatisfaction for our customers and wasted processing time for our staff.
  •  Each month we are 5-7 days late completing this process, impacting other departments and generating late fees for the company.
  •  This piece of work costs the organization $5,000 per month. Best practices in similar companies is half that amount.

report

Step Two: Draw It!

So now, take your “good” problem definition from last week , and think about the process(es) that contribute to it. There are many types of process maps out there, each serving a different purpose. We like to use the swim lane process map because it allows you to identify the ‘hand offs’ or touch points in the process. At this point you are mapping the As-is current state process, not the Should-be (in an ideal world), or Thought-to-be (what we think it looks like).  Get everyone in the room who touches that process and talk about what “ACTUALLY” happens.

There are four steps you need to remember when mapping a process.


  1. Determine level of detail. A high level view of your process will require 3- 5 process steps, while a more detailed view can have up to 20 process steps.
  2. Lay out your swim lanes. Identify how many people, positions, teams or departments are involved in the process (keep in mind the level of detail you have chosen to map it) . Create a swim lane for each. Your process should flow from the top to the bottom, left to right. So if your administrative assistant or your client starts off the process, their lane should be placed at the top. The same, if your shipping department is the last to finish the process, their lane should be placed at the bottom.
    whiteboardconsulting.ca/staging: Peacocks and Processes
  3. Use your Shapes. The are 4 key shapes to use when mapping. The oval represents the start and the end of your process. The rectangle represents your process step. The diamond represents your decision point. The arrows represent direction and connection. The diamond is the fork in the process and therefore will always two arrows, a Yes and No.
  4.  Number your Steps. Although the arrows help with direction, sometimes with complicated processes, you lose track of the flow, especially if there are a lot of decision point. For this reason it is important to number your process steps.


So get out your whiteboards, sticky notes, and markers, and start to Draw It! Let us know what you find out!

Leave us a comment below!


Until next week,

Nicole